
 Excel
 PowerPoint





Consistent fonts, colours, footnotes and source lines — the details a VP marks up first.
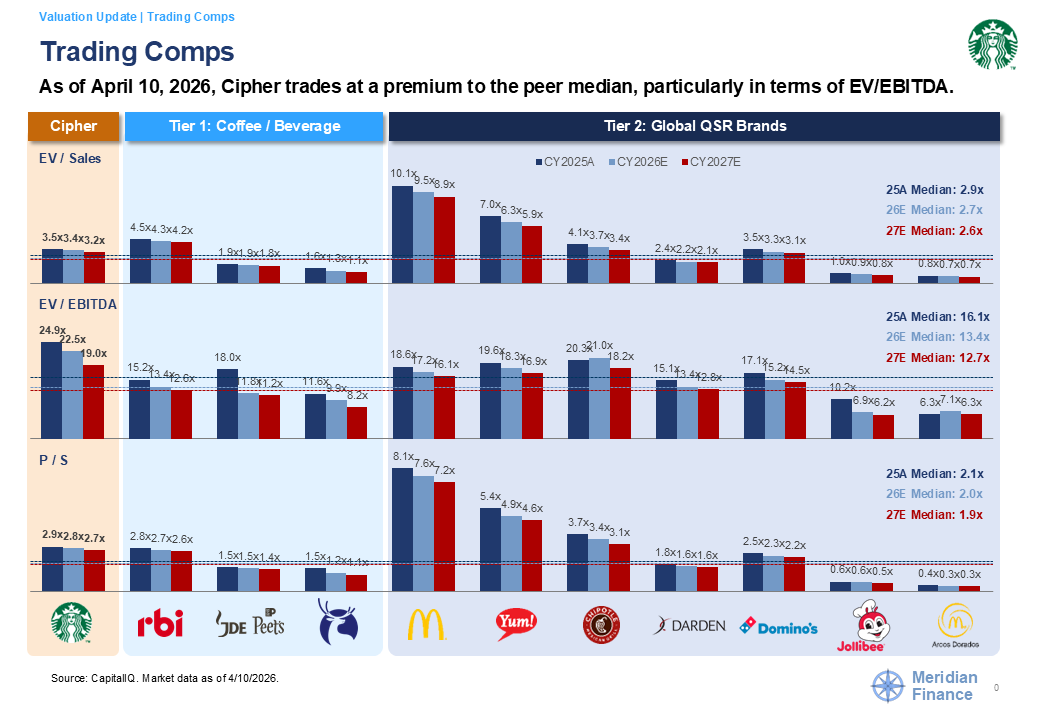
Comps sets, timelines and profiles laid out the way deal teams actually build them.
Native PowerPoint and Excel — no flattened images. Swap in your data and go.
 Best value
 Best value
 Special offer
 Special offer
 Special offer
 Special offer
 Special offer
 Special offer
 Special offer
 Special offer
 Special offer
 Special offer
 Special offer
 Special offer
 Special offer
 Special offer
 Special offer
 Special offer
 Special offer
 Special offer
 Special offer
 Special offer
 Special offer
 Special offer
 Special offer
 Special offer